Profiling a .NET Core 3.0 Console App running in Docker for Windows with dotTrace
07 Dec 2019Recently, I was asked to profile a .NET Console App running in Docker for Windows. I’m a big fan of the JetBrains tools for .NET: ReSharper, dotPeek, dotTrace - they are all part of my toolbelt. Since I’ve never profiled a Docker container with dotTrace, this post shall illustrate how to do this.
First of all, we need some code to profile. The complete code can be downloaded from this GitHub repo. But basically, it is nothing more than this:
using System;
using System.Threading.Tasks;
namespace TestWithDocker
{
internal class Program
{
private static async Task Main()
{
while (true)
{
await Task.Delay(1000);
DoSomeWork();
}
}
private static void DoSomeWork()
{
for (var i = 0; i < 100; i++)
{
Console.WriteLine(new Random().Next());
}
}
}
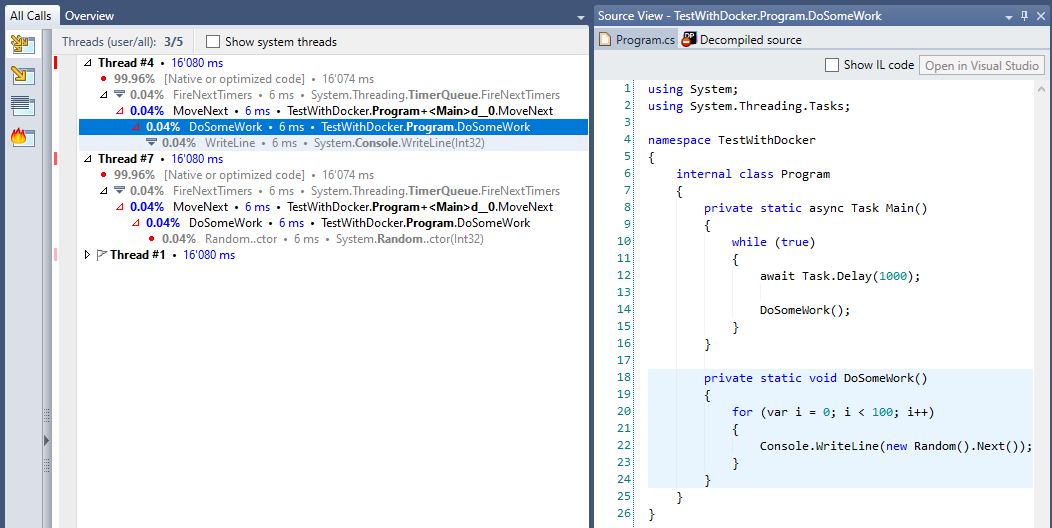
}As we can see, every second 100 random numbers will be generated and printed to the console.
Furthermore, a Dockerfile is needed and it looks like this:
FROM mcr.microsoft.com/windows/servercore:1903

COPY bin/Release/netcoreapp3.0/win-x64/* ./

ENTRYPOINT ["TestWithDocker.exe"]
We’re pulling the base image mcr.microsoft.com/windows/servercore:1903, adding the compiled application and setting it as the ENTRYPOINT.
Before building the Docker image, the application has to be built using the dotnet global tool:
dotnet publish -c ReleaseAfterwards, we can build the Docker image:
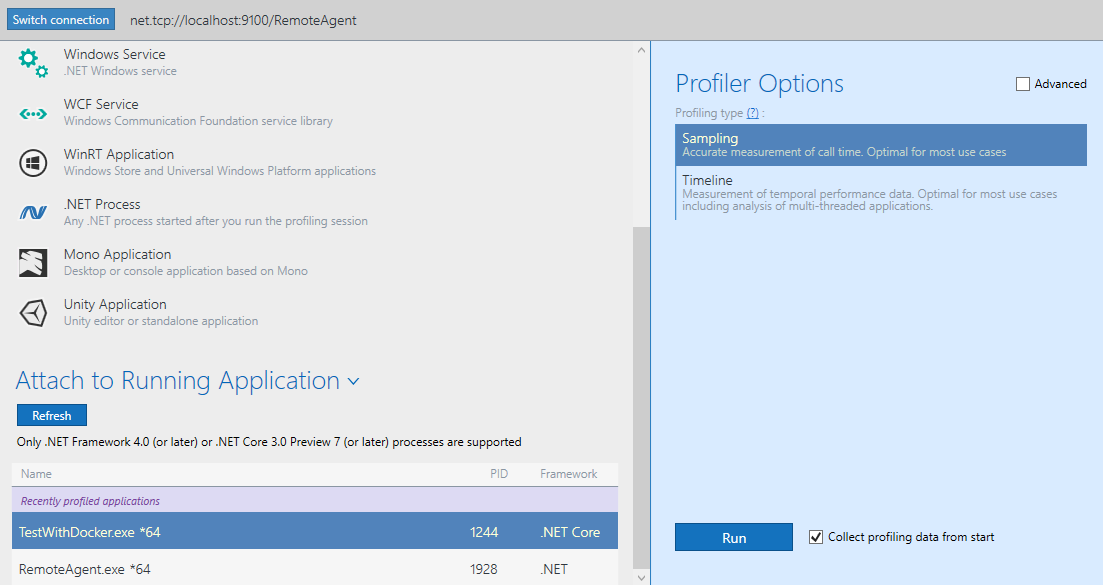
docker build -t test-with-docker .Before running and profiling the container, please make sure that you have dotTrace installed and if not happened yet, make your self comfortable with the how-to Starting Remote Profiling Session. In summary, it says the following:
- Unzip
RemoteAgent.zipto the environment to profile (in our case the Docker container). - Start dotTrace and connect to the Remote Agent URL. By default, the Remote Agent uses port 9100.
- Attach to the application.
So lets do this step by step. At first, we will start the Docker container and map the container port 9100 to its local pendant:
docker run -d -p 9100:9100 --name test test-with-dockerTo copy the unzipped Remote Agent, the following command has to be executed:
docker cp RemoteAgent/. test:/RemoteAgentThis copies all the content from the host’s folder RemoteAgent to the container’s folder RemoteAgent. In case this commands fails saying that you cannot copy content while a container is running: this seems to be a Windows/Hyper V limitation. We can work around this by stopping the container, copying the content and finally starting it again:
docker stop test
docker cp RemoteAgent/. test:/RemoteAgent
docker start test
Now the Remote Agent is there, but is has to be started:
docker exec -d test RemoteAgent/RemoteAgent.exeFinally, we can connect to our application using dotTrace. As Remote Agent URL, we use net.tcp://localhost:9100/RemoteAgent. This accesses the local port 9100 of my machine which is mapped to port 9100 of the Docker container where the Remote Agent is up and running. Now we can attach dotTrace to TestWithDocker.exe and collect snapshots as usual.
As you can see in the following screenshot, everything works as usual when profiling an application and we find our method DoSomeWork():