
Analyzing the EF Core Query Cache
13 Mar 2023As I mentioned a couple of times, we at Swiss Post strive for a Cloud-first approach and embrace various techniques and tools to make that happen. But sometimes, these tools can guide you into a completely wrong direction if not understood properly - as it happened to me last week 😅
Here’s what happened
All of our applications are Docker-ized and run on K8s. To get an easy overview of the applications health, .NET metrics are collected and visualized in Grafana. Here’s what a typical Grafana dashboard looks like for one of our applications:
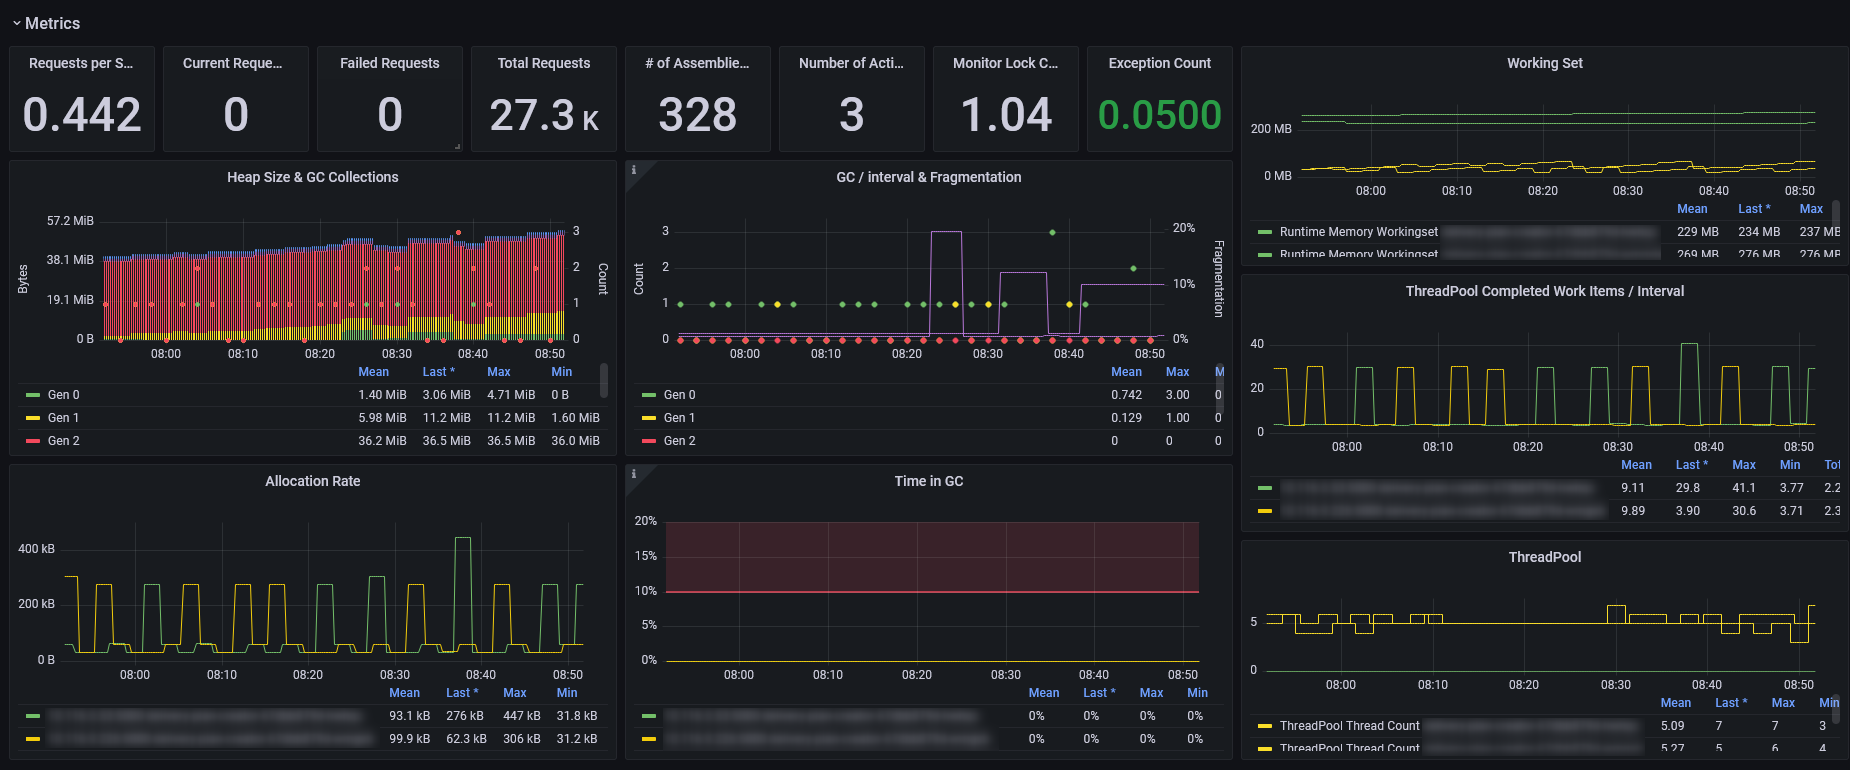
It contains a lot of .NET EventCounters that you can find here and we do have metrics for EF Core as well:
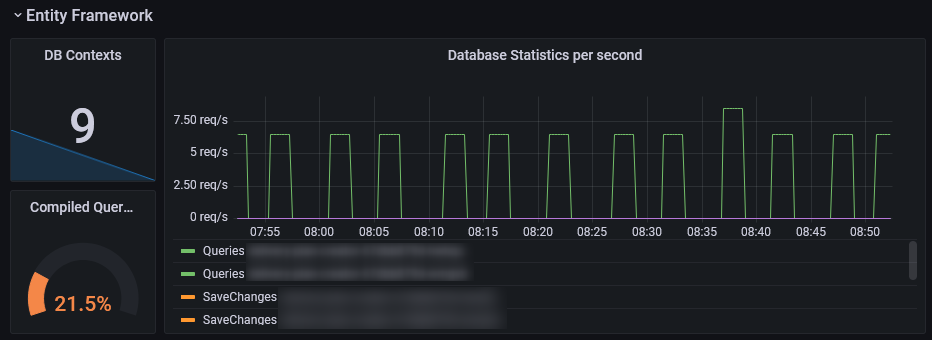
In the lower left corner of the previous screenshot, you see the Compiled Query metric, referring to the EF Core Query Cache Hit Rate which is specified as following (taken from here):
The ratio of query cache hits to misses. The first time a given LINQ query is executed by EF Core (excluding parameters), it must be compiled in what is a relatively heavy process. In a normal application, all queries are reused, and the query cache hit rate should be stable at 100% after an initial warmup period. If this number is less than 100% over time, you may experience degraded perf due to repeated compilations, which could be a result of suboptimal dynamic query generation.
Well, I think it’s safe to say that 21.5% is not very close to 100% 😉 since the docs do not state how to analyze this kind of problem, I asked on Stack Overflow, giving me some very helpful feedback.
Log query compilation
EF Core has a ton of additional log statements which are not enabled by default. One of this is CoreEventId.QueryCompilationStarting which gets logged when an EF Core query needs to be (re)compiled.
I’ve enabled the log statement by adding the following line when configuring EF Core:
dbContextOptionsBuilder
    .ConfigureWarnings(warning => warning.Log(CoreEventId.QueryCompilationStarting, LogLevel.Information));
Since it’s an Info log, appsettings.json needs to be updated as well:
{
  "Logging": {
    "LogLevel": {
      "Microsoft.EntityFrameworkCore.Query": "Information"
    }
  }
}
When deploying this change, the following log statements appeared in our logging platform Splunk:
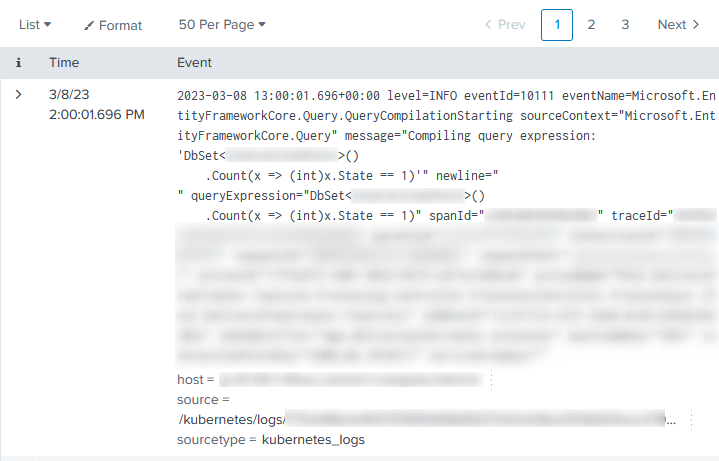
To obtain a meaningful result, I left the application alone overnight and looked at the logs the next morning. I’d expected certain queries to be recompiled over and over again, causing the bad EF Core Query Cache Hit Rate metric. But to my surprise, all queries were compiled only once, so I had to go one step further.
Custom ICompiledQueryCache
Another hint I received on Stack Overflow was to implement my own query cache and see what’s going on inside. I just copy and pasted the original sources from GitHub and extended it with some log statements:
public class LoggingCompiledQueryCache : ICompiledQueryCache
{
    private readonly ILogger<LoggingCompiledQueryCache> _logger;

    public LoggingCompiledQueryCache(IMemoryCache memoryCache)
    {
        _memoryCache = memoryCache;
        using ILoggerFactory loggerFactory = LoggerFactory.Create(builder => builder.AddConsole());
        _logger = loggerFactory.CreateLogger<LoggingCompiledQueryCache>();
    }

    public virtual Func<QueryContext, TResult> GetOrAddQuery<TResult>(object cacheKey, Func<Func<QueryContext, TResult>> compiler)
    {
        // code left out for brevity
        try
        {
            lock (compilationLock)
            {
                if (_memoryCache.TryGetValue(cacheKey, out compiledQuery))
                {
                    EntityFrameworkEventSource.Log.CompiledQueryCacheHit();
                    _logger.QueryCacheHit();
                }
                else
                {
                    EntityFrameworkEventSource.Log.CompiledQueryCacheMiss();
                    _logger.QueryCacheMiss();
                    // code left out for brevity
                }

                return compiledQuery!;
            }
        }
        // code left out for brevity
    }
}
With these additional logging messages:
public static partial class Log
{
    /// <summary>
    ///     This was a EF Core Query Cache hit.
    /// </summary>
    /// <param name="logger">The logger.</param>
    [LoggerMessage(
        EventId = 50001,
        Level = LogLevel.Information,
        Message = "This was a EF Core Query Cache miss.",
        SkipEnabledCheck = true)]
    public static partial void QueryCacheHit(this ILogger logger);

    /// <summary>
    ///     This was a EF Core Query Cache miss.
    /// </summary>
    /// <param name="logger">The logger.</param>
    [LoggerMessage(
        EventId = 50002,
        Level = LogLevel.Information,
        Message = "This was a EF Core Query Cache miss.",
        SkipEnabledCheck = true)]
    public static partial void QueryCacheMiss(this ILogger logger);
}
Finally, the existing CompiledQueryCache needs to be replaced with the custom implementation:
dbContextOptionsBuilder
    .ReplaceService<ICompiledQueryCache, CompiledQueryCache, LoggingCompiledQueryCache>();
Let’s take it apart one by one:
- The custom
LoggingCompiledQueryCacheimplements the same behavior as the originalCompiledQueryCache. LoggingCompiledQueryCachelogs each time if the underlying_memoryCacheis either hit or missed viaQueryCacheHit()orQueryCacheMiss().
With these information at hand, I could calculate my own query cache hit rate in Splunk:
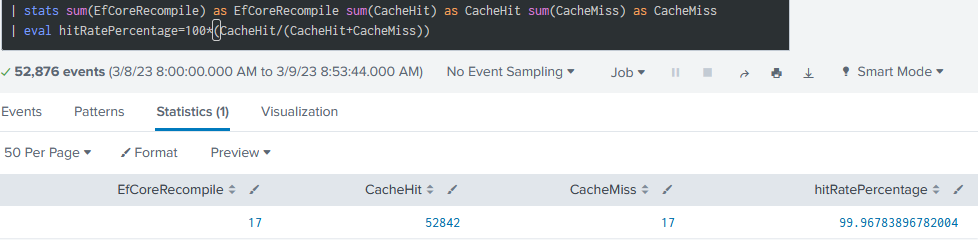
And that was one of these moments when you should leave your notebook, drink a hot cup of coffee and ask yourself why you’ve chosen this job - why is the calculated value 99.9% but Grafana displays 21.5%? 🤯
Analyzing the metric in Grafana
When taking a closer look into the data in Grafana, I noticed a lot of of -1 values:
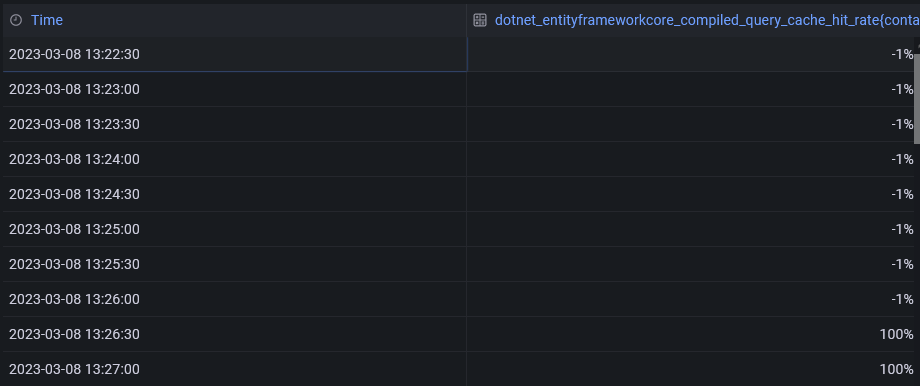
That felt quite odd to me - where are these values coming from? The answer lies in the EF Core code for calculating this metric:
var hitsAndMisses = clone.Hits + clone.Misses;

// Report -1 for no data to avoid returning NaN, which can trigger issues in downstream consumers
return hitsAndMisses == 0
    ? -1
    : ((double)clone.Hits / hitsAndMisses) * 100;
If the cache hasn’t been hit at all (e. g. no traffic), -1 is reported to avoid a division by zero. But let’s calculate an average made up of five datapoints:
((-1) + (-1) + (-1) + (-1) + 100) / 5 = 19.2
Due to all the -1 values, the average query cache hit rate gets pulled down to 19.2% - and that perfectly describes my initial problem: the affected app runs only every couple of minutes, the other time it is idle. During idle times, the metric reports -1, thereby bringing down the average.
Conclusion
There are multiple solutions:
- Exclude the
-1values in Grafana. - Implement a custom
EventListenerand remove the-1before writing the metric at all.
We decided for the second way, but I think it’s really up to the use case.
For me it was a super interesting story to see how EF Core works under the hood, how you can reveal internal behavior by adding more logs and even replace internal components like the CompiledQueryCache due to .NET’s modular approach - and to take a closer look into the reported metric values 😉
Thanks for reading and have a great time!
